What your Mac is really doing: the complete guide
Six questions answer almost every complaint about a Mac — where the space went, what is running, where the data goes, why the memory is full, what dead apps left behind, what starts on its own. The order to ask them in, and where each one leads.
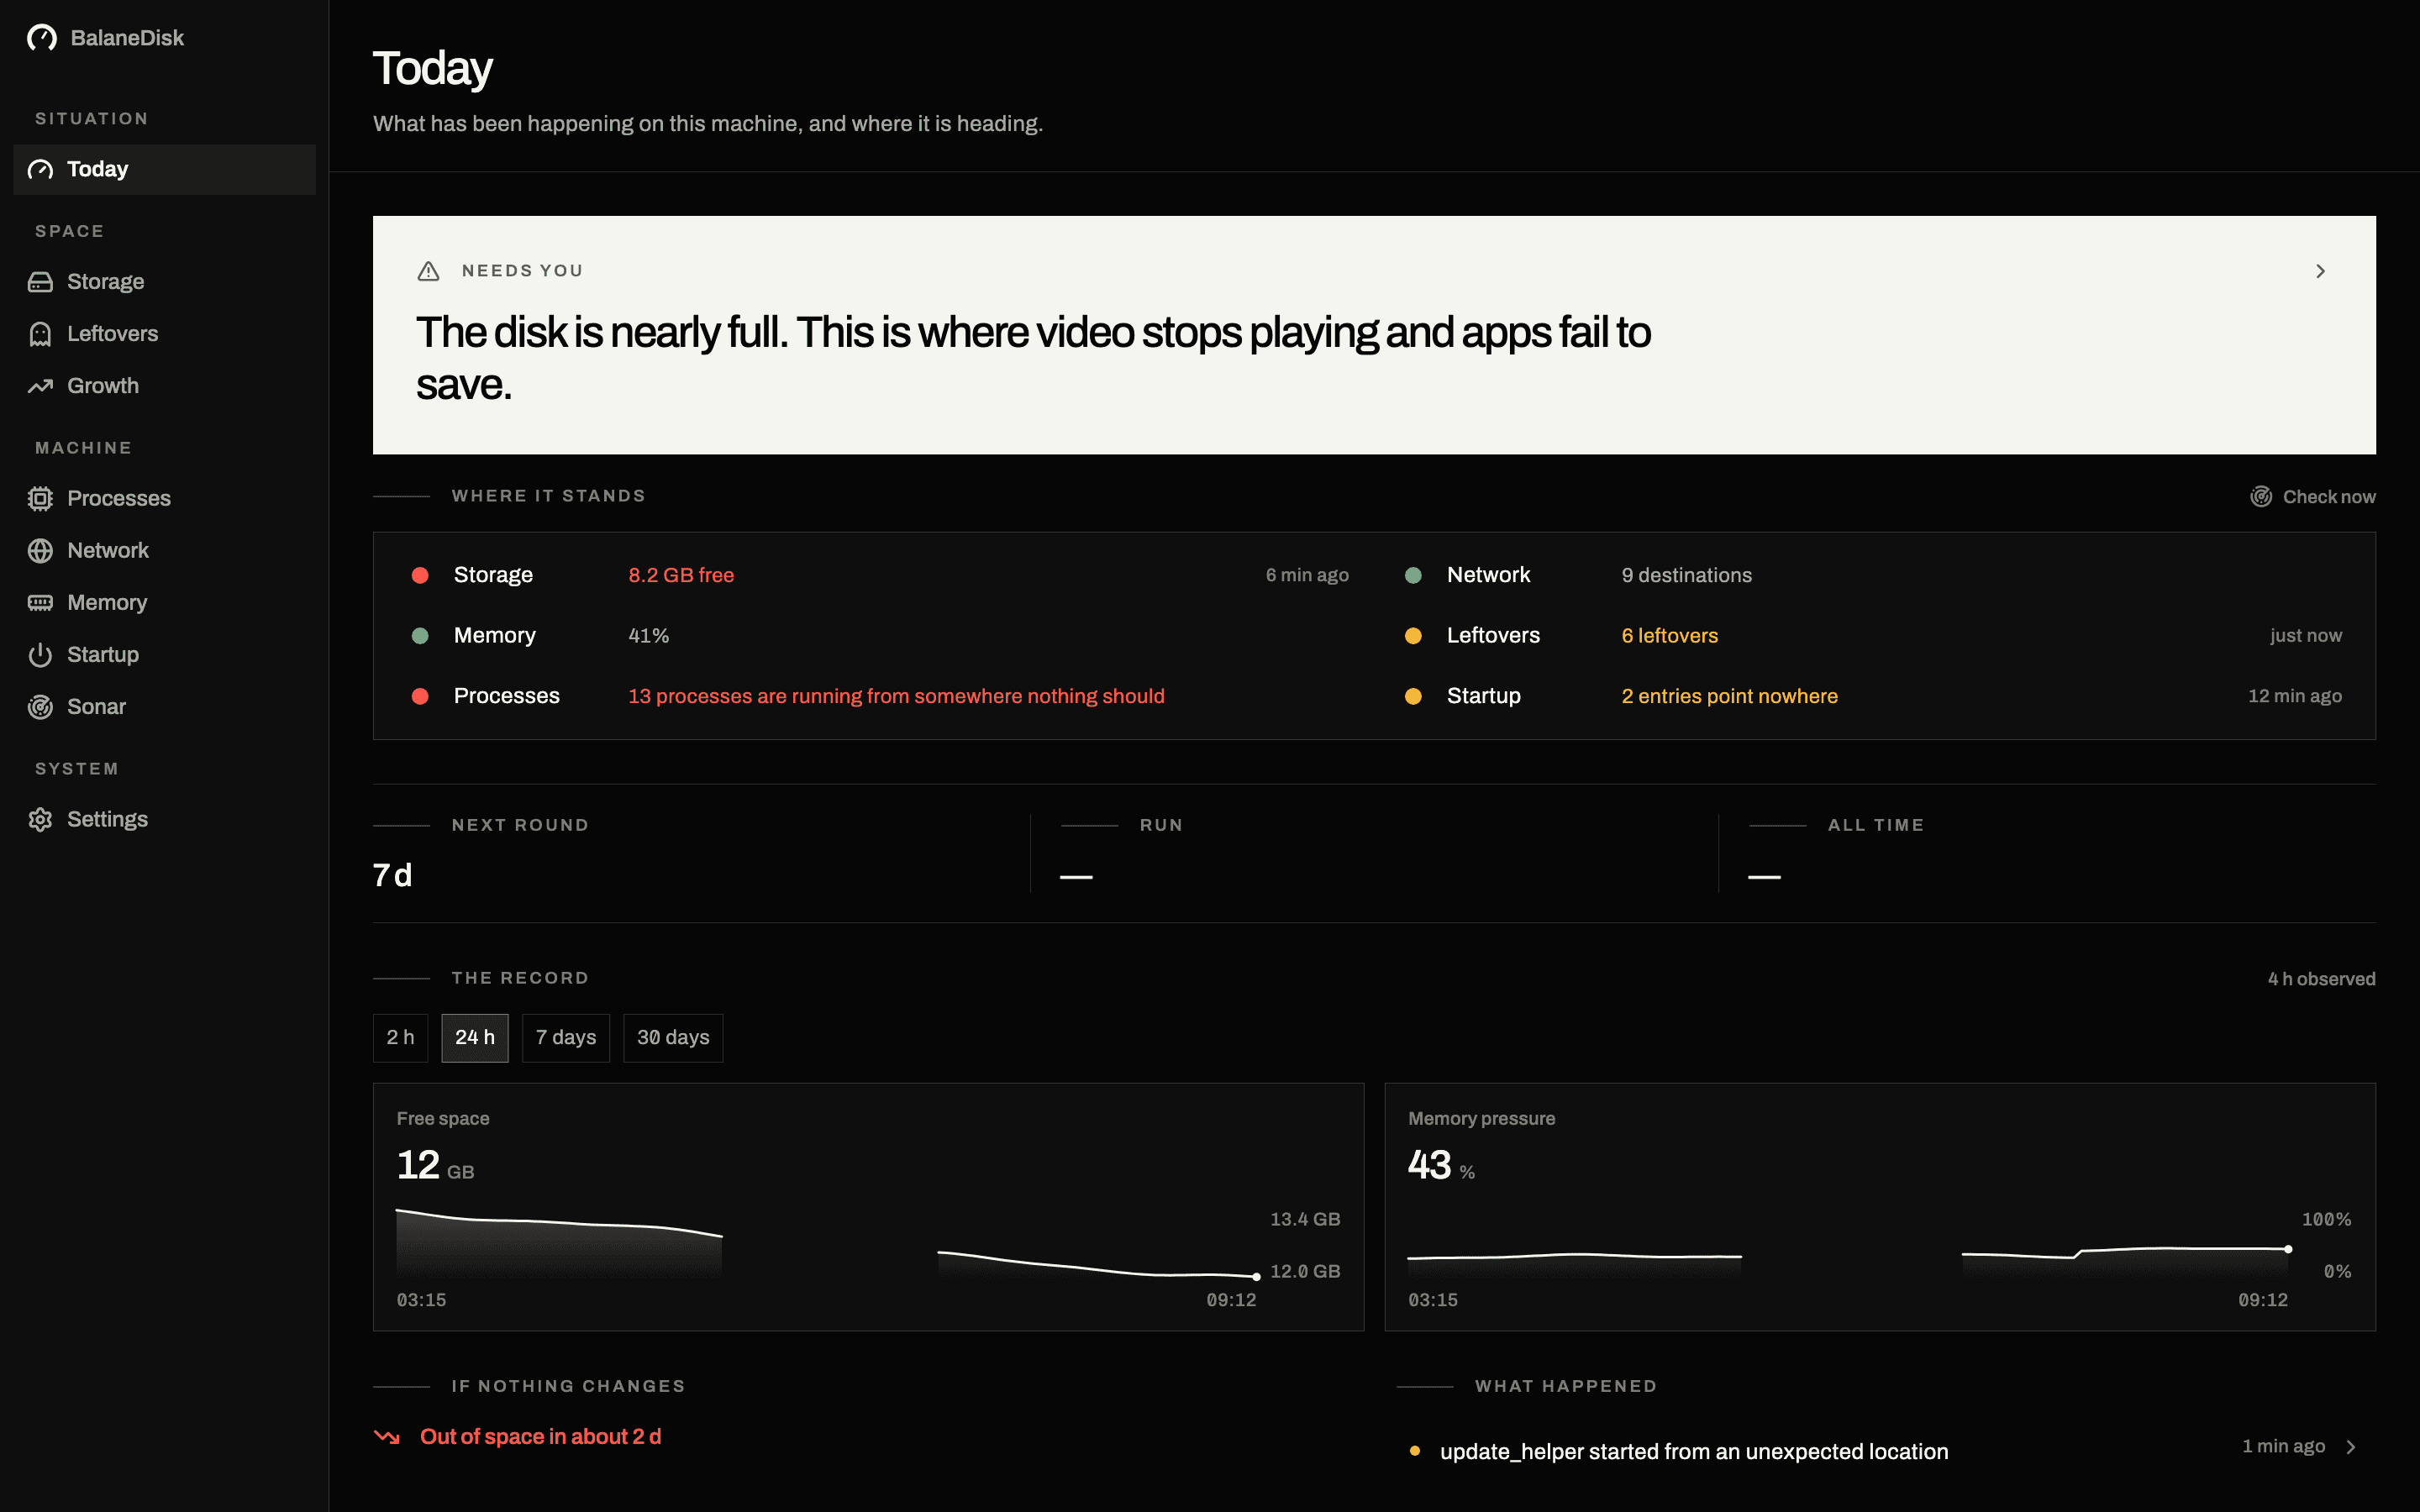
Most complaints about a Mac — it is slow, it is full, the fan will not stop, something is talking to the internet — come down to six questions. This is the map: what each question is, how to answer it with what is already installed, and which article goes deep on it.
Read it in order. The order is not arbitrary; the first answer changes what the later ones mean.
1. Where did the disk space go?
Why first: below roughly 10–15 % free space, APFS slows down measurably at creating snapshots and writing large files, and some applications abort a save rather than wait. A "slow Mac" is a full Mac often enough that checking anything else first wastes your time.
The built-in check: System Settings → General → Storage. Useful for the total, close to useless for the breakdown — the largest slice is usually "System Data", which is not a category at all but the remainder macOS could not file anywhere else.
What it is actually made of: hidden folders under ~/Library, APFS snapshots that Time Machine left behind, developer caches, and Docker if you have it. Twelve places, and Finder shows you almost none of them.
→ Mac storage full: where the gigabytes actually hide → Docker is eating your Mac's disk: what prune really deletes
2. What is running right now?
Why second: once space is ruled out, a slow machine is usually one loud process, and the name in Activity Monitor rarely explains itself. mds_stores at 240 % looks alarming and is Spotlight finishing a job. kernel_task at 400 % looks worse and is the system protecting itself from heat.
The built-in check: Activity Monitor, CPU tab, sorted by % CPU. Then two questions about the top entry: what is it, and is the load finite?
What to look for beyond the name: the path it runs from, and whether it carries a valid signature. A process running out of /tmp, /var/folders or Downloads is not automatically hostile — installers and build tools look exactly like that — but it belongs on the short list you actually read.
→ WindowServer, mds_stores, kernel_task: what these processes actually do
3. Why is the memory full?
Why third: because the answer is usually "it is supposed to be", and believing otherwise sends people to software that makes their machine slower.
The built-in check: Activity Monitor → Memory → the pressure graph at the bottom. Not the free-memory figure. macOS deliberately fills spare memory with file cache, because empty memory does nothing for you. Five percent free with green pressure is a healthy machine; forty percent free with red pressure would be a sick one.
What a real shortage looks like: pressure that stays elevated for hours and does not fall after you quit large applications, together with growing swap. If it only spikes during an export and settles afterwards, it was the export.
→ Memory pressure, not free RAM: the only number that counts
4. Where is this machine sending data?
Why fourth: it is the question with the least tooling and the most at stake. A Mac nobody is sitting at opens dozens of connections in ten minutes, and that is normal — time sync, certificate revocation, push delivery, software update, and the updater of every application you installed.
The built-in check: lsof -i -P -n lists open sockets with process names; nettop -P shows live traffic per process. Both give you IP addresses. Which company sits behind them is left for you to look up — and that lookup is the problem, because performing it online means handing the list of your destinations to a third party.
What is worth noticing: not that traffic exists, but who produces it and where it goes.
→ Where does my Mac send data? How to find out
5. What did removed applications leave behind?
Why fifth: because it is invisible by construction. Dragging an app to the Bin removes the bundle. It does not remove the preferences, the caches, the application support folder or the several gigabytes filed under a reverse-DNS identifier you will never recognise as belonging to a program you deleted in 2023.
The built-in check: none. This is one of the genuine gaps in macOS.
What makes it hard to automate: matching a leftover folder to a departed application is a judgement, not a fact. com.example.helper might belong to something you removed, or to something you still use under a different name. Which is exactly why a confidence score and a "look first" label beat an automatic delete.
→ Why BalaneDisk never deletes anything
6. What starts on its own?
Why last: it explains the other five. A machine that is slow from the first second after login has something starting with it, and login items are only part of the picture — launch agents and daemons under ~/Library/LaunchAgents, /Library/LaunchAgents and /Library/LaunchDaemons start things that never appear in System Settings.
The built-in check: System Settings → General → Login Items, which now lists background items too, but flattens them into on/off switches with no indication of what any of them is holding right now.
The order, in two minutes
- 01Free space. Under 15 %? Fix that first; several of the other symptoms are consequences.
- 02Activity Monitor, CPU. One loud process, or many quiet ones?
- 03Memory pressure graph. Green with full memory is fine. Amber or red that persists is not.
- 04If the fan is the complaint: check for heat before you check for processes —
kernel_taskis the countermeasure, not the cause. - 05If privacy is the complaint:
lsof -i -P -n, and resolve names locally.
Why this is a measuring problem, not a cleaning problem
Every question above ends in a judgement: is this normal, is this mine, is this safe to remove. Cleaning apps skip that step, because the step is hard and the deletion is easy. That is how a 40 GB folder gets filed as "cache" while named Docker volumes sit inside it.
BalaneDisk answers all six on one machine — storage, processes, network, memory, leftovers, startup — and stops at the judgement. It shows the size, explains what the thing is, and hands you either the owning tool's own command or the folder open in Finder. It measures and never deletes. There is no account, and nothing it measures leaves the machine.
Windows user? The same six questions, different answers: what your PC is really doing.
Questions people ask
- Why is my Mac slow all of a sudden?
- In practice it is almost always one of four things: a full or nearly full disk, a single process holding the CPU, memory pressure that stays high after large applications are closed, or thermal throttling via kernel_task. The order matters — check free space first, because below roughly ten percent everything else gets slower as a consequence.
- What is the first thing to check on a slow Mac?
- Free disk space, then Activity Monitor sorted by CPU, then the memory pressure graph — not the free-memory number. Three checks, about two minutes, and they separate a hardware problem from a software one before you change anything.
- Do I need a cleaning app for macOS?
- You need a measuring tool. Deleting is the easy part and the part you can do yourself; knowing which forty gigabytes are safe to delete is the hard part, and it is the part cleaning apps guess at. A named Docker volume and a build cache look identical from the outside.