Memory pressure, not free RAM: the only number that counts
A full memory bar is healthy — and a whole industry sells software that calls it a problem. What pressure measures, why "free up RAM" makes a machine slower, and how a real shortage actually looks.
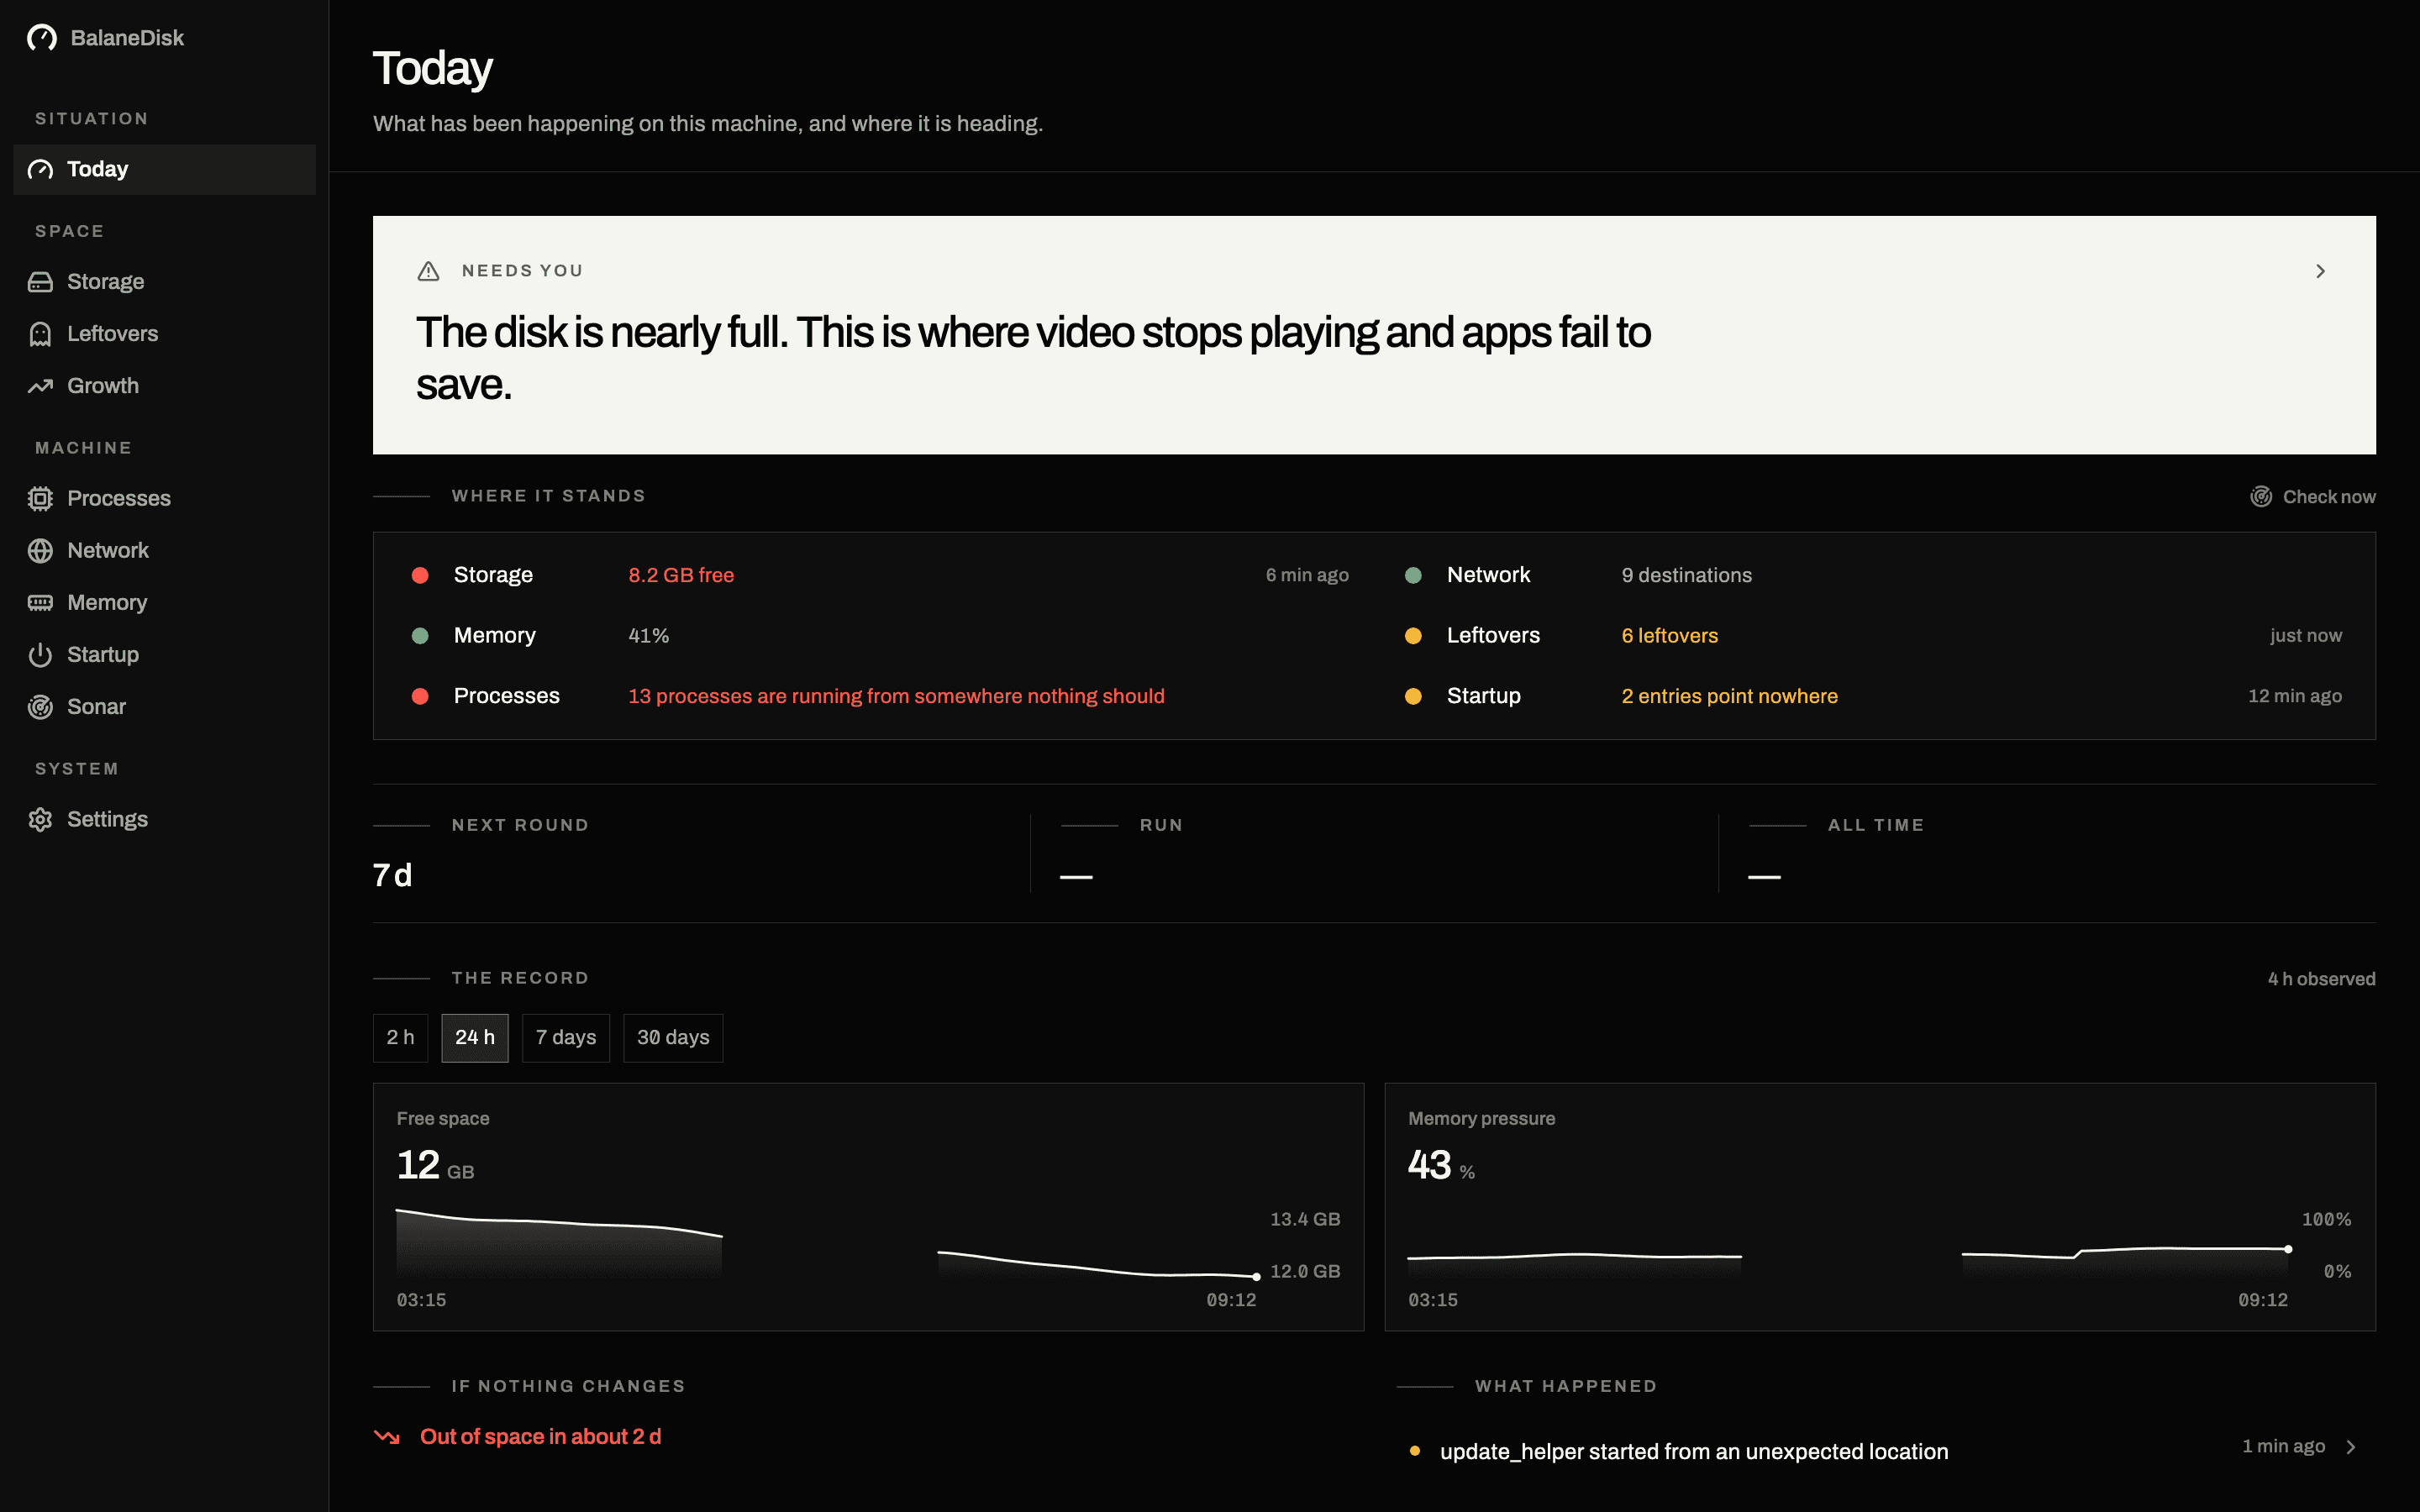
There is one number that gets misread on every computer, and a whole genre of software lives off it: free memory.
An empty stick of RAM is wasted money
macOS and Windows fill spare memory on purpose. Anything not needed right now becomes file cache: libraries an app loaded ten minutes ago, thumbnails, parts of the documents you are working on. That is not a leak, that is the design. Memory left empty has done nothing for you.
So "only 1.2 GB free" on its own says nothing at all — about as much as a full fridge.
What actually counts
The question is not how much is free but how hard the system has to work to keep everything in memory. That is what pressure measures: as its own figure on macOS, derived from commit charge and paging activity on Windows.
Normal
Everything runs from RAM. 95 % used is fine.
Elevated
Compressing, dropping cache, first swapping.
Critical
Paging to the SSD continuously. This is what feels slow.
A machine at 96 % used with green pressure is healthy. A machine at 60 % used with red pressure has a problem. Usage alone does not tell the story.
The four states behind the colour
| State | What the system is doing | Do you notice? |
|---|---|---|
| Free | unused memory, waiting for work | no |
| File cache | recently read files kept ready | yes — everything feels fast |
| Compressed | rarely used pages packed down | barely; costs some CPU |
| Swapped | pages living on the SSD | yes — this is the stutter |
The step from "compressed" to "swapped" is where a metric turns into an experience. Everything before it is bookkeeping.
Where to read it, on each system
macOS. Activity Monitor → Memory. The graph at the bottom is the pressure; the numbers above it are the four states. For swap, the terminal is more direct:
sysctl vm.swapusageused climbing into the gigabytes and staying there is the signal. A few hundred megabytes of swap on a machine that has been up for a week is not.
Windows. Task Manager → Performance → Memory. There is no single pressure figure, so three numbers have to be read together:
| Reading | What it means |
|---|---|
| In use | physical memory currently held |
| Cached | file data kept ready — not a problem |
| Committed | total promised to processes, used / limit |
Committed climbing well past physical memory, with the disk staying busy, is the Windows shape of a real shortage. A large Cached number is the system working correctly. Resource Monitor (resmon) → Memory adds Hard Faults/sec, which is the closest thing Windows has to a direct pressure reading: sustained hard faults mean pages are being fetched from disk because they were not in memory.
The consumers that are usually behind it
Before concluding you need more RAM, it is worth knowing what actually eats it on a modern machine:
- Browser tabs. Each one is effectively a process. A hundred open tabs is a hundred small applications.
- Electron applications. Chat clients, editors and note apps that each bring their own browser engine along. Four of them is four browsers.
- Virtual machines and containers. Whatever you assigned to Docker Desktop or a VM is gone from the host, allocated up front and not shared back.
- Photo and video editors. They will use everything you have and give it back on quit, by design.
That list matters because the fix differs. Tabs and Electron apps you can close. A VM's allocation you can lower in its settings. An editor's appetite you can ignore, because it is not a leak.
Why software still offers to "free up memory"
Because the number is visible and the button feels good. What those tools usually do is purge or an equivalent call: they throw away the file cache. Afterwards the display says more is "free" — and the machine is slower for the next few minutes, because everything it just discarded has to come back from the SSD.
It is metric optimisation. The readout wins, the person loses.
The curve beats the moment
An instant value cannot tell "an export is running" from "something is wrong here". A curve can:
- Sawtooth — rises while you work, falls afterwards: normal.
- Staircase upwards — rises and never returns: something is not releasing.
- Permanently high with swap — not enough RAM for what you are doing. No tool fixes that; fewer things at once or more memory does.
That is why BalaneDisk draws the forecast as a straight line over the curve rather than as a model: you should be able to check it against the measurement instead of trusting a number whose origin you cannot see.
Short version
- 01Ignore "free memory".
- 02Read pressure — over hours, not in the moment something annoys you.
- 03If pressure stays elevated, go looking for the largest consumer, not for a release button.
- 04If none of that applies: your computer is using the memory exactly as you paid for it to.
When more RAM is genuinely the answer
Three conditions together, not one of them alone:
- 01Pressure stays elevated (or Committed stays above physical) for hours, not during a task.
- 02It does not fall after you quit the largest applications.
- 03Swap or hard faults keep growing while you work normally.
If all three hold, the machine is short of memory for what you actually do with it, and nothing installable will change that. If only the first holds, you found a busy afternoon. On Apple silicon, where memory cannot be added later, that distinction is worth getting right before buying the next machine.
Next: WindowServer, mds_stores, kernel_task explained · What your Mac is really doing · What your PC is really doing
Questions people ask
- How much free memory is normal?
- Very little. macOS and Windows deliberately fill spare memory with file cache, because empty memory does nothing for you. Five percent free with green pressure is a healthy machine; forty percent free with red pressure would be a sick one.
- Does "free up RAM" or purge help?
- The readout looks better for a moment, and then the machine is slower for several minutes: everything thrown out of the cache has to come back from the SSD. It optimises a metric, not the experience.
- How do I know I actually need more RAM?
- From the curve, not the moment: pressure that stays elevated for hours and does not fall after you quit large applications, together with growing swap. If it only spikes during exports and settles afterwards, it was the export.