Where does my PC send data? How to find out on Windows
An idle Windows machine opens dozens of connections in ten minutes. How to find out which program is talking where — with netstat, Resource Monitor and PowerShell, and why looking the destinations up online defeats the point.
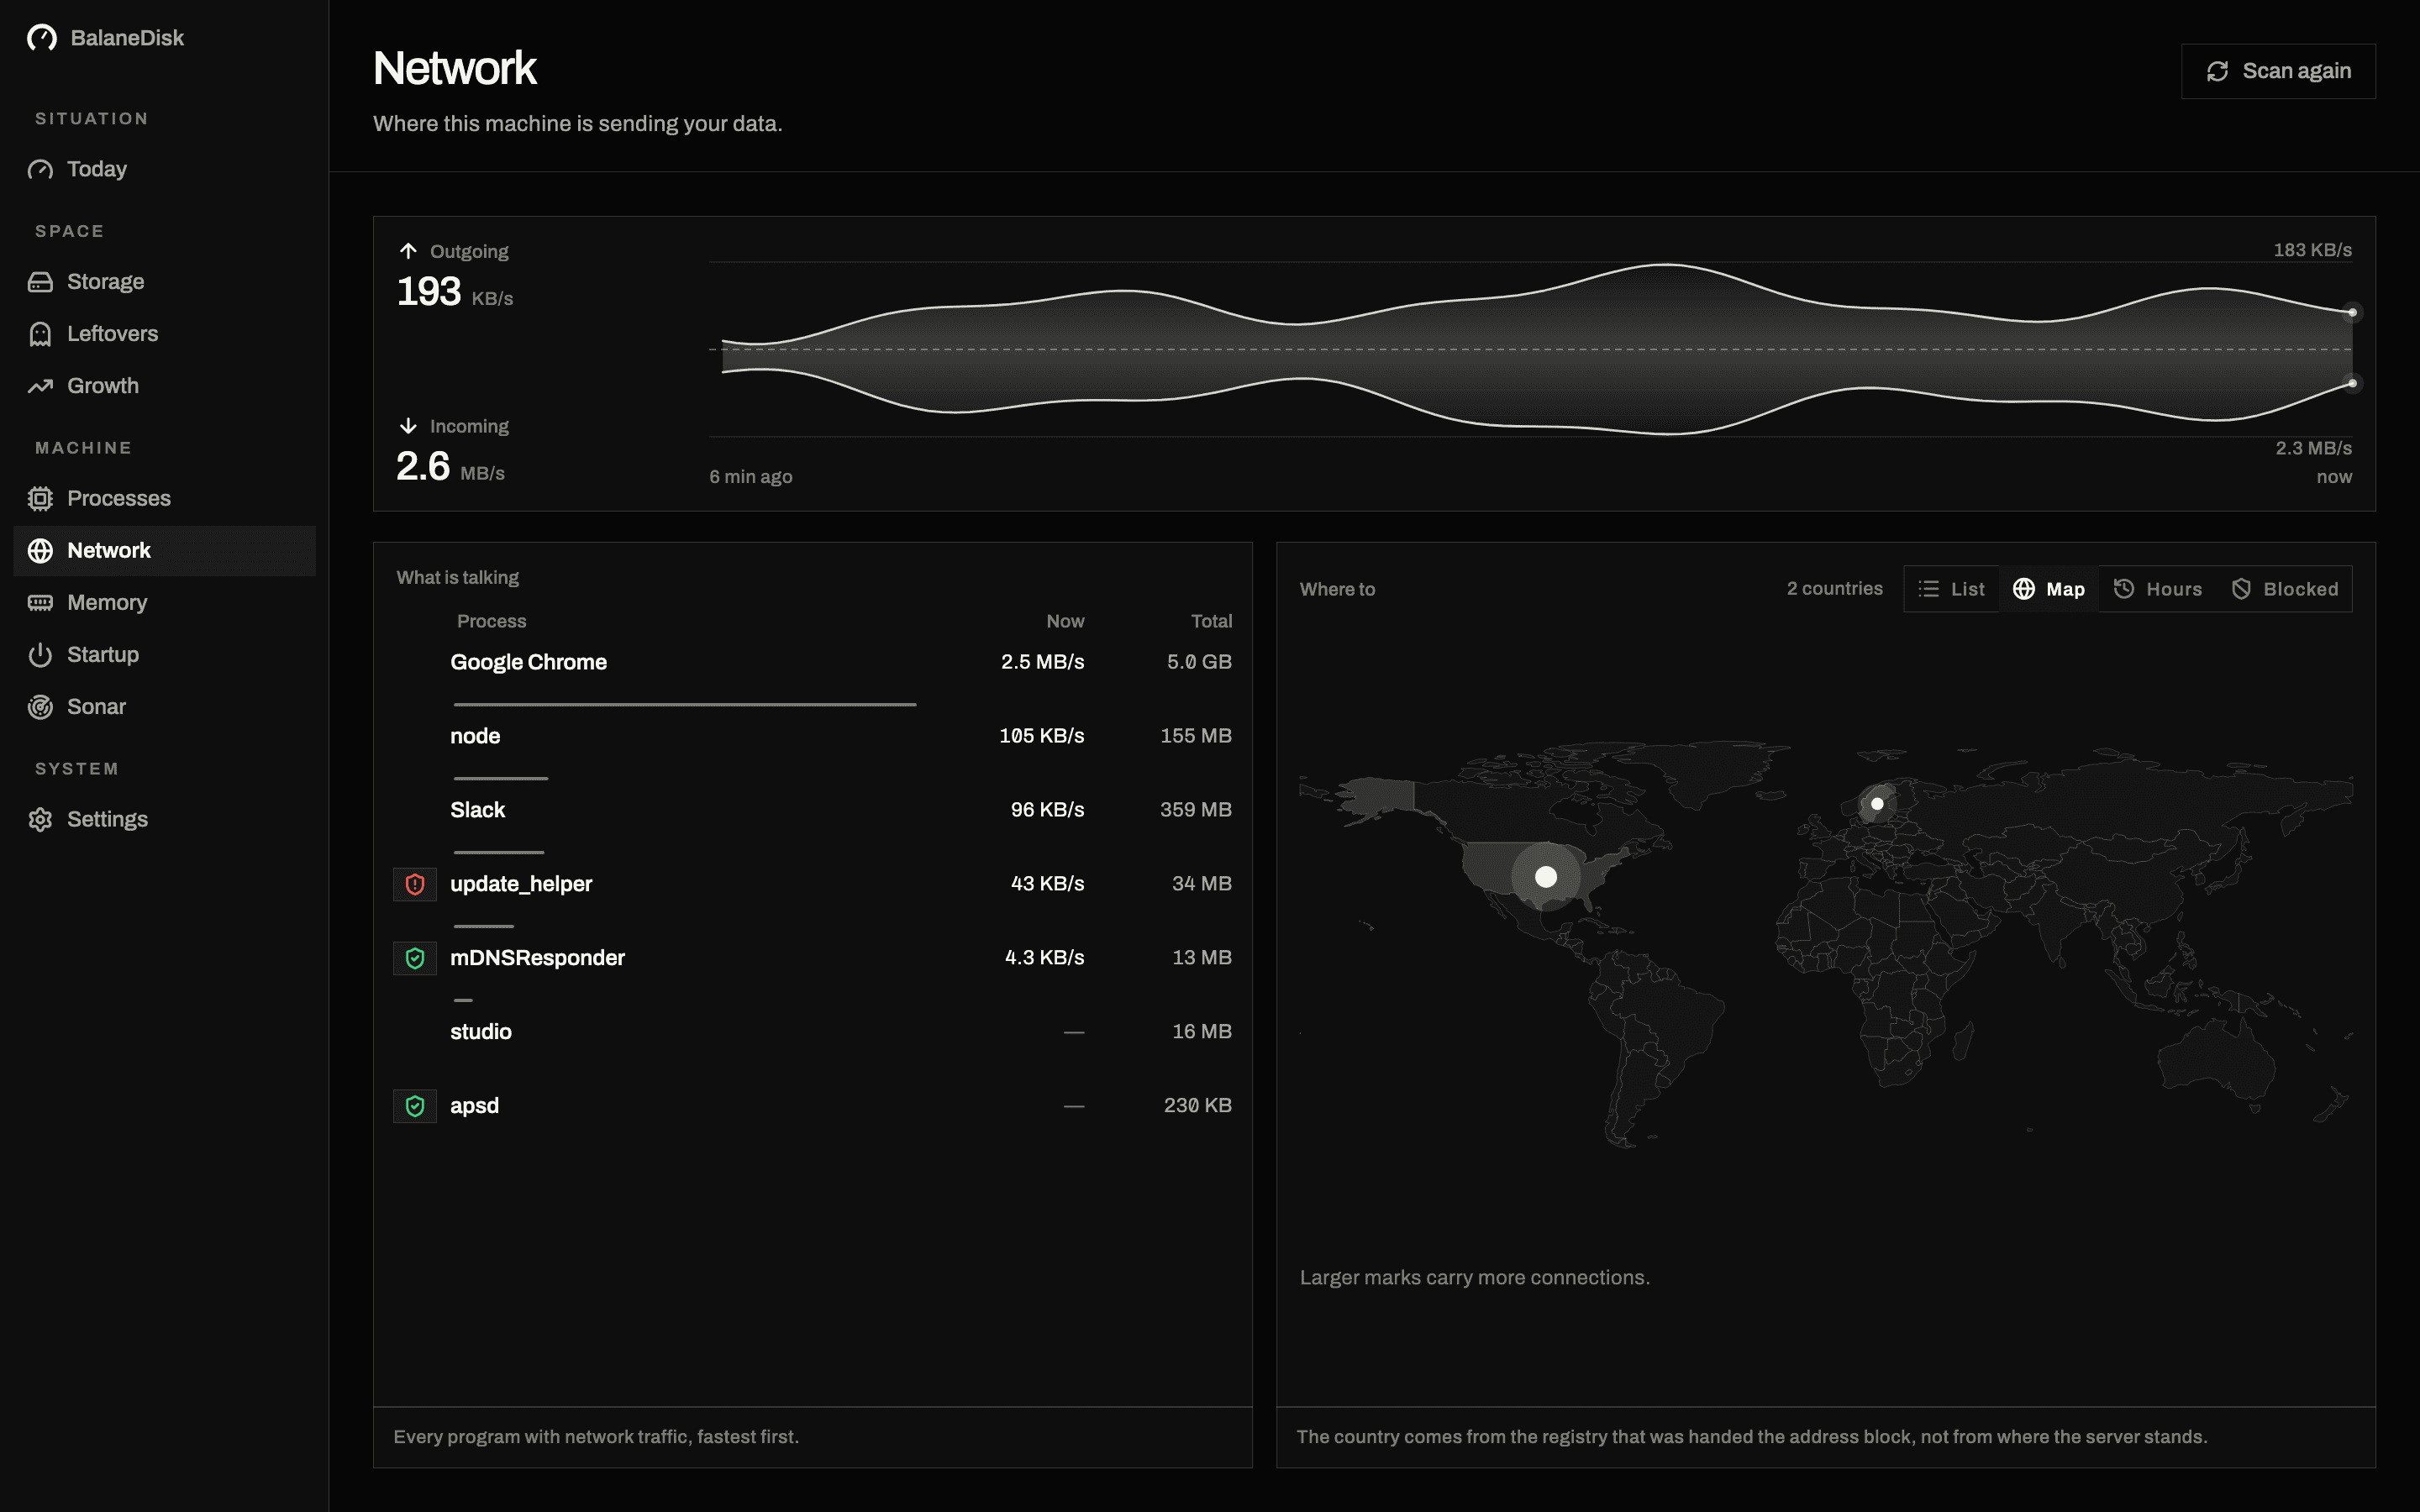
Leave a freshly installed Windows 11 machine alone for ten minutes. Do not open a browser. Do not touch anything. Then count the open connections.
It will be dozens. That is not a compromise, and it is not a scandal — it is what a modern operating system does. But "it is normal" is a bad answer to a fair question, and the fair question is: which program, to whom, and why?
Three routes that are already on your machine
netstat, the oldest and still the clearest
Open a terminal as administrator — without that, the -b flag has nothing to show you:
netstat -abno-aall connections and listening ports-bthe executable that owns each one-nnumeric addresses, no name lookups-othe process ID
You get a wall of text with the owning program printed under each entry. That is the whole point: it is the only built-in view that puts the program name and the remote address on screen together, without you having to match up PIDs by hand.
The catch is that it is a snapshot. A connection that opens, sends 200 bytes and closes will simply not be there when you look.
Resource Monitor, for watching it happen
Press Win+R, type resmon, open the Network tab. Three things live there:
- Processes with Network Activity — bytes per second, per process
- Network Activity — each connection with its remote address
- TCP Connections — the live table, with latency
This is the only built-in tool that gives you volume per process, and it is worth knowing why: it runs an ETW trace session under the hood. Windows has no ordinary API that attributes bytes to a process. The performance counters that look like they might are measuring disk and pipe I/O with a similar-sounding name. Any tool that shows you per-process traffic volume is either running ETW as well, or estimating.
PowerShell, for a list you can actually work with
Get-NetTCPConnection -State Established |
  Select-Object OwningProcess, RemoteAddress, RemotePort |
  Sort-Object RemoteAddress
Join it to the process names and you have the full picture:
$procs = Get-Process | Select-Object Id, ProcessName, Path
Get-NetTCPConnection -State Established | ForEach-Object {
  $p = $procs | Where-Object Id -eq $_.OwningProcess
  [pscustomobject]@{
    Process = $p.ProcessName
    Path    = $p.Path
    Remote  = "$($_.RemoteAddress):$($_.RemotePort)"
  }
} | Sort-Object Process | Format-Table -AutoSize
Get-NetTCPConnection has one genuine advantage over the macOS equivalent: it names the owning process for every connection on the machine, including other users' and service accounts'. On macOS, lsof without root shows you only your own. On Windows, the machine-wide list is right there.
What normal looks like
Before you go hunting, know what you will find on a healthy machine. These are the regulars:
| What you will see | Who it is | Why it talks |
|---|---|---|
svchost.exe → Microsoft ranges | dozens of services in one host process | update, time, telemetry, licensing |
msftconnecttest.com | NCSI | the check behind "Internet access" in the tray |
MsMpEng.exe | Microsoft Defender | cloud-delivered protection lookups |
time.windows.com | Windows Time | clock sync |
OneDrive.exe | OneDrive | sync, even with nothing changed |
msedge.exe, chrome.exe (no window) | browser background tasks | extension updates, push, preloading |
| OCSP / CRL endpoints | certificate revocation | checking that a certificate is still valid |
Store / WinStore.App | app updates | on its own schedule |
svchost.exe is the one that makes the list unreadable, because it is not one thing. Dozens of Windows services share it, and the name tells you nothing about which one opened the connection. To find out:
Get-WmiObject Win32_Service -Filter "ProcessId = 1234" | Select-Object Name, DisplayNameThat turns "svchost is talking to Microsoft" into "the Delivery Optimization service is talking to Microsoft", which is an answer you can act on.
The three things actually worth noticing
A program with no window and no reason. An installer that finished last week and still has a process talking to its own update server every hour is not malicious. It is also not something you agreed to.
A destination that does not match the program. A PDF reader connecting to an analytics company is a design decision somebody made, and you are allowed to disagree with it. This is where the company behind the address matters far more than the address itself.
A binary running from a temporary or user-writable folder. Anything running out of %TEMP%, Downloads or a user AppData folder that also holds network connections deserves a second look — starting with whether it carries a valid Authenticode signature at all.
None of these are alarms. They are the short list worth reading.
The lookup problem nobody mentions
Here is where most network tools quietly undo their own purpose.
An IP address on its own tells you nothing. 52.113.194.132 is not information. To make it useful, something has to resolve it to a company and a country — and the easy way to do that is to ask a server: a WHOIS query, a reverse-DNS lookup, a geolocation API.
Think about what that request contains. It contains the list of everywhere your computer connects to, handed to a third party, one address at a time. A tool built to show you where your data goes has just sent your data somewhere.
The usual route
- Address 104.18.x.x
- → to a server
- → name comes back
That server now knows every destination your machine talks to.
The route here
- Address 104.18.x.x
- → database on disk
- → name, locally
Nothing leaves. The price: the list is as fresh as the last update.
That is why BalaneDisk carries the database instead of querying one. Company and country are resolved from data bundled inside the application, on your machine, with no request leaving it. On Windows it reads the connections through the same TCP/IP cmdlets you would use by hand — every connection on the machine, not just yours — and it is honest about the one thing Windows does not hand over: without an ETW session there is no per-process byte counter, so it reports no volumes rather than a plausible wrong number, and the screen simply drops the columns it cannot fill.
What to do with what you find
- 01Identify the process, not the address. The address is a consequence; the program is the decision.
- 02For
svchost.exe, resolve the PID to a service before concluding anything. - 03Decide per program, not per connection. A program you no longer use that still phones home should be uninstalled, not firewalled.
- 04Outbound firewall rules are a real option — Windows Defender Firewall with Advanced Security → Outbound Rules → New Rule. The default is to allow outbound; blocking one program by path is a supported, reversible change.
- 05Do not block by IP address. They rotate. You will be maintaining a list forever and blocking the wrong things by next month.
Next: Antimalware Service Executable: why MsMpEng.exe eats your CPU · Windows storage full: where the space actually goes
Questions people ask
- How do I see which program is connecting to the internet on Windows?
- Three built-in routes. netstat -abno in an administrator terminal lists every connection with the owning executable. Resource Monitor (resmon), Network tab, shows the same live and adds bytes per second per process. Get-NetTCPConnection -State Established in PowerShell gives you the machine-wide list including other users' connections, which is where it beats the equivalent on macOS.
- Is it normal for an idle Windows PC to keep sending data?
- Yes. Windows Update, the connectivity check against msftconnecttest.com, telemetry, Defender's cloud lookups, Store app updates, time sync, certificate revocation checks and the updaters of everything you installed all talk without you doing anything. What is worth noticing is not that traffic exists, but who produces it and where it goes.
- Why can't a tool tell me how many bytes each program sent?
- Windows exposes no per-process byte counter through its ordinary APIs — the performance counters that look like they might are measuring disk and pipe I/O. Resource Monitor gets those numbers by running an ETW trace session. Anything reporting per-process volume without one is either running ETW too, or guessing.